Categories
Reposts

Bootstrapping a Fresh Mac Setup in Minutes

Like many developers, I enjoy doing a clean install of macOS from time to time. It keeps the system lean, removes accumulated clutter, and gives me a fresh development environment.

However, the biggest pain after a clean install is reinstalling all the tools, apps, and configurations required for development. Over the years, I’ve tried different approaches — manual installs, Homebrew bundles — but recently I created a neat utility that simplifies the process.

The tool is mac-bootstrap, available on GitHub here:
Mac bootstrap
https://github.com/davinc/mac-bootstrap

https://github.com/davinc/mac-bootstrap

What It Does

This utility helps bootstrap a new Mac environment automatically. Instead of manually installing everything after a fresh OS install, you can run a script that installs and configures the tools you need.

Typically, Mac bootstrap scripts automate tasks such as:

  • Installing development tools
  • Installing applications via package managers like Homebrew
  • Setting up shell environments and dotfiles
  • Applying system preferences and developer defaults

These scripts are commonly used to provision a brand-new machine quickly, turning hours of setup work into a repeatable automated process. 

Why I Like This Approach

When I do a clean macOS install, I want to reach a fully working development environment quickly. With a bootstrap script:

  • Setup becomes repeatable
  • Configuration stays documented in code
  • A new machine can be ready in minutes instead of hours

It also acts as a living checklist of everything I consider essential on my Mac.

A Small Tip

If you frequently reinstall macOS or move between machines, maintaining a bootstrap script like this is extremely useful. Over time, you can customize it with:

  • Your favorite tools
  • Development frameworks
  • System tweaks
  • CLI utilities

Eventually, setting up a new Mac becomes as simple as cloning a repo and running one command.

Categories
Reposts

Productivity in software development: the lean perspective

In a long tradition of consultants imposing cookie-cutter solutions, McKinsey introduced a framework to measure developer productivity, which has triggered strong reactions in the software community (from Dan NorthKent Beck, or Gergely Orosz).

The problem with productivity is not measuring it, but why we measure it in the first place. When we decide to measure something, it is because we have recognized a gap of knowledge we need to fill to improve our chances of making the business numbers. Halve the bad, double the good, the lean mantra goes. Reduce the number of bugs by half, reduce the delivery lead time by half, double the number of zero bug features, double the number of experts in the team, double the positive customer feedback, and so on. Productivity only measures how fast and efficient we are at learning and improving to reach those ambitious goals.

Flavian Hautbois

https://blog.buildtosell.org/productivity-in-software-development-the-lean-perspective/

Flavian discusses the topic of productivity in software development from a lean perspective. He criticizes McKinsey’s approach of measuring productivity and introduces three key insights from lean thinking that can lead to developing exceptional software developers.

The first insight emphasizes that measuring productivity should focus on the team’s learning curve and improvement, rather than using it as a reporting or command-and-control tool. Lean productivity measurement considers the number of value units delivered to clients per full-time equivalent per day.

The second insight highlights the importance of team productivity over individual productivity. Lean thinking values teamwork, collaboration, and continuous improvement fostered by a team leader. It discourages measuring individual productivity, which can create a culture of competition and hinder teamwork.

The third insight focuses on the role of managers as coaches to team leaders. The lean approach believes that improving team performance involves working on product quality and creating favorable work conditions. Managers should trust individuals and teams, provide support, and encourage them to suggest and implement process improvements.

Categories
Reposts

DORA Metrics: Measuring Engineering Team Performance

DORA Metrics: the Right Answer to measuring engineering team performance

“What metrics should I use to measure my engineering team’s performance?”

I get asked this question often enough to be worth an FAQ.

You might expect my answer to be “it depends” but no: I believe there’s a single right answer! More precisely, there’s an established set of metrics that are so good, so widely applicable, that they should be your starting point.

Jacob aka @jacobian

The DORA metrics mentioned in the article – Deployment Frequency (DF), Lead Time For Changes (LT), Change Failure Rate (CFR), and Mean Time To Recovery (MTTR) – are indeed a great starting point for measuring the performance of an engineering team. These metrics have been extensively researched and found to correlate with successful, high-performing teams.

However, it is important to note that these metrics should not be treated as rigid targets from the outset. It is suggested to measure and monitor these metrics for a period of time before deciding what is considered “good” for your specific team. Prematurely setting targets can lead to Goodhart’s Law, where the measure becomes a target and loses its effectiveness as a measure.

Furthermore, it is crucial to carefully define ancillary terms associated with these metrics. Terms such as “failure,” “recovery,” “change,” and others should be clearly defined to ensure consistency in measurement. Take the time to define how these values will be measured within your team.

The article also provides real examples of how different types of teams can apply the DORA metrics. For example, a feature team may measure DF by counting deploys per day, LT by measuring the time from when an issue is moved to “In Progress” to when it is closed, CFR by determining the percentage of deploys causing a failure, and MTTR by calculating the time to resolve incidents or bugs.

Similarly, a security engineering team may measure DF indirectly by looking at the teams they are embedded in, LT by monitoring their own changes, CFR by tracking security issues introduced during their involvement, and MTTR by measuring the time between initial discovery and final remediation.

An SRE team, on the other hand, may monitor DF and CFR for each component team they support and measure MTTR on an organization-wide basis.

Are you an Elite DevOps performer? Find out with the Four Keys Project explores the four key metrics that organizations can use to evaluate their DevOps practices and drive continuous improvement. I found it to be a valuable resource for anyone interested in enhancing their DevOps performance.

Overall, adopting the DORA metrics requires skill and understanding of the subtleties involved. While these metrics provide a solid foundation, it is also essential to consider additional metrics specific to your team’s goals and objectives. Regular monitoring, root cause analysis, and adjustment based on the relative change in performance can contribute to continuous improvement and align team efforts towards success.

Categories
Reposts

Scaling Your Team From 5 to 250 Engineers: A Complete Guide | Athenian

When your engineering team is small, you have visibility into all the nitty-gritty details of your software delivery pipeline. You know which tickets are moving, you know the CI runs, and you probably even know which PRs are pending.

But, as your business and team grow, the challenges you face evolve. And you’re pulled further and further away from those valuable details. 

The more you zoom out on the map, the less visibility you have. Fortunately, you can always zoom in when needed.

The trick is to know where to zoom in. 

Today we will delve into the challenges you will face as your organization scales from 5 to 250 engineers by focusing on three dimensions of your software development pipeline:

  1. Velocity
  2. Quality
  3. Outcome 
Eiso Kant

Scaling Your Team From 5 to 250 Engineers: A Complete Guide | Athenian

Engineering Leaders have two responsibilities: 

👉 Improve the developer experience

👉 Deliver impact to the end-user 

These two are infinitely linked, and, when done successfully, will help you create a culture of continuous improvement. We believe this can be done with the right metrics and data. 

Categories
Reposts

The untold history of macOS System Preferences

The untold history of macOS System Preferences

Categories
Reposts

RICE: Simple prioritization for product owners

RICE: Simple prioritization for product owners

Categories
Reposts

Amazon Simple Queue Service (SQS) – 15 Years and Still Queueing! | Amazon Web Services

Amazon Simple Queue Service (SQS) – 15 Years and Still Queueing! | Amazon Web Services

Categories
Reposts

Watches and Wonders Geneva 2021 | Jaeger-LeCoultre

Unfold the infinity. In 1931, Jaeger-LeCoultre launched a timepiece that was destined to become a classic of 20th-century design: the Reverso. Created to withstand the rigours of polo matches, its sleek, Art Deco lines and unique reversible case make it one of the most immediately recognisable watches of all time. Today, 90 years after the Reverso was born, the Grande Maison celebrates the watchmaking icon by releasing the most complicated timepiece ever presented in this emblematic collection.

Categories
Reposts

Automating safe, hands-off deployments

Automating safe, hands-off deployments

Categories
Reposts

WAF Security Automations | AWS Solutions

WAF Security Automations | AWS Solutions

Categories
Reposts

Amazon ECS Service Discovery | Amazon Web Services

Amazon ECS Service Discovery | Amazon Web Services

Amazon Elastic Container Service (Amazon ECS) now includes integrated service discovery. This makes it possible for an ECS service to automatically register itself with a predictable and friendly DNS name in Amazon Route 53. As your services scale up or down in response to load or container health, the Route 53 hosted zone is kept up to date, allowing other services to lookup where they need to make connections based on the state of each service. 

Categories
Reposts

Learn & Master ⚔️ the Basics of RxSwift in 10 Minutes

Learn & Master ⚔️ the Basics of RxSwift in 10 Minutes

Categories
Reposts

A crash course on optimizing your Docker images for production

A crash course on optimizing your Docker images for production

Categories
Reposts

A crash course on Docker — Learn to swim with the big fish

A crash course on Docker — Learn to swim with the big fish

Categories
Reposts

How to destroy user experience with too many choices

How to destroy user experience with too many choices

Categories
Reposts

3 Feature Prioritization Techniques With Your Users In Mind

3 Feature Prioritization Techniques With Your Users In Mind

Categories
Reposts

People Don’t Buy Products, They Buy Better Versions of Themselves

People Don’t Buy Products, They Buy Better Versions of Themselves

Categories
Reposts

The Strange Politics of the “Full-Stack Developer”

The Strange Politics of the “Full-Stack Developer”

Categories
Reposts

Unboxing Chrome – Hannah Lee

Unboxing Chrome – Hannah Lee

Categories
Reposts

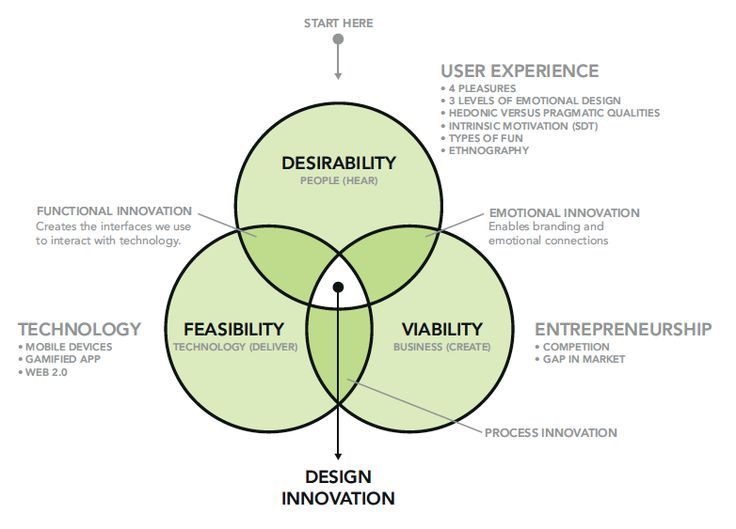
A product should be desirable, feasible and viable

ux-studio:

A product should be desirable, feasible and viable. You have to find all of them, but start with desirability.